ProAnalysis is the analysis engine used by CommunityViz Pro. In day-to-day use, you configure formulas/functions in the add-in and run them against map layers (feature layers/tables), optionally by scenario.
Use a CommunityViz Analysis when you want to:
Evaluate indicators from attributes (sum, mean, min/max, median).
Calculate nearest-feature relationships (distance, angle, attribute transfer).
Run network-based nearest calculations (distance/value via network travel).
Build intermediate spatial outputs (for example, spatial join outputs).
Open ArcGIS Pro and your project that contains CommunityViz Pro layers.
Confirm the CommunityViz Pro add-in is installed and licensed.
Load the map/layers you want to analyze.
If you are using dynamic/scenario data, confirm your scenario fields/filters are available.
Set a valid output workspace for tools that create output feature classes.
Select the host layer (the layer you are calculating for).
Select the target layer (if the function compares across layers).
Choose the function/tool type (statistical, proximity, network, or spatial join).
Set optional scenario inputs (host/target scenario) and whether to use only current selection.
Run the function and review output fields or output feature class.
Save your project and (if needed) persist output datasets to your project geodatabase.
This guide explains how to use the primary CViz Pro ribbon tools in two closely related areas:
Analysis Active Scenario (the scenario selector)
Analysis Components (Scenarios, Tags, Data, Charts, Assumptions, Indicators, Attributes, and Saved Views)
In the CViz Pro ribbon, these tools are the foundation for setup, data management, and day-to-day scenario switching. The add-in organizes commands into classes (groups) that work together:
CViz Pro Active Scenario: chooses the currently active scenario for edits/calculations.
Analysis Components: opens managers and panes where you define, view, and organize your model components.
Analysis Utilities: analysis-level actions such as settings, updates, templates, help, and 3D view.
Analysis Sketch: map editing workflow tools (Paint, Style Manager, Suspend/Resume updates).
Guided Analysis Modeling: wizard-driven modeling tools (Suitability, Land Use Designer, Allocator, BuildOut).
Use Core Scenario + Analysis Components first to establish structure and content. Then use the other classes to configure advanced behavior, run guided methods, and refine map editing workflows.
A scenario is a named version of your analysis state (assumptions, attributes, indicator results, and map edits) that you can compare against other alternatives.
The Scenarios button opens the Scenario Manager window where you create, rename, reorder, and remove scenarios.
The CViz Pro Active Scenario selector (combo box on the ribbon) sets the scenario that receives edits and updates. This allows you to set which scenario is currently in focus. Values shown in panes (and many edits/calculations) are interpreted in that selected scenario context.
Assumptions, Indicators, Attributes, Charts, and Data Layers are related parts of one analysis model. A change in one component can influence other components through formulas and dependencies.
Managers (Scenarios, Tags, Saved Views) are typically for administration and organization.
Panes (Data, Charts, Assumptions, Indicators, Attributes) are for active review, editing, and analysis operations.
You generally cycle through: define scenario(s) -> adjust assumptions/attributes -> review indicators/charts -> compare scenarios -> refine.
Summary of Scenario Concepts
Scenarios tool (Scenario Manager): manage the scenario list itself. Use it at the beginning of analysis to set up alternatives and again throughout the process as options evolve.
Active scenario selector: control the “active scenario” you are working in. It determines where your changes go. Before editing assumptions, features, formulas, or tool settings, confirm the selected active scenario. When you switch the selector, CViz Pro changes the active scenario context so subsequent edits apply to that scenario. The selector updates automatically if scenarios are added, removed, or renamed.
Assumptions: set different policy/economic/environment values per scenario; use the active scenario selector to ensure edits apply to the intended alternative.
Attributes/Formulas: compute scenario-dependent fields and outcomes; updates reflect the currently active scenario.
Indicators: evaluate KPI differences (cost, capacity, performance, impact) across scenarios.
Charts: communicate side-by-side scenario outcomes and trend differences.
Suitability / Allocator decision tools: test land suitability and allocation outcomes under each scenario’s assumptions and constraints.
Tags and organization tools: keep large scenario libraries understandable, especially in collaborative projects.
Set up alternatives first
Open Scenarios and create baseline + alternatives (for example: Existing Conditions, Moderate Growth, High Growth).
Define organization standards
Use Tags to establish consistent categories for assumptions/indicators/charts (policy theme, geography, objective, etc.).
Confirm data participation
Open Data pane and verify required layers are included and correctly configured for analysis.
Select the target scenario
Use the Active Scenario selector before entering edits.
Enter policy/testing inputs
Update values in Assumptions and relevant Attributes for the active scenario.
Review model performance
Use Indicators to evaluate outcomes and formula-driven metrics.
Use Charts to communicate differences and identify directionally important changes.
Capture review checkpoints
Save useful map/result states with SavedViews for team review and stakeholder reporting.
Repeat and compare
Switch active scenarios and repeat steps 5-7 until alternatives are decision-ready.
Always check Active Scenario before editing.
This avoids updating the wrong alternative.
Name scenarios clearly.
Include intent in the name (e.g., Transit Focused, Housing Priority) to reduce confusion.
Use tags early, not late.
Tagging from the beginning keeps filters and review sessions manageable as complexity grows.
Keep a stable baseline scenario.
Avoid frequent baseline edits; use it as your comparison anchor.
Use SavedViews for recurring QA checks.
Create one Saved View per recurring map check so repeat reviews are faster and consistent.
Validate data layer readiness before deep modeling.
Many downstream issues are avoided by checking layer setup in the Data pane first.
Review indicators and charts together.
Indicators show numeric outcomes; charts reveal patterns and communication-ready summaries.
Adopt small, incremental edits.
Make a few changes, review outcomes, then continue. This improves traceability and team confidence.
These tools establish structure and content for your Scenario Planning analysis. Use the other classes to configure advanced behavior, run guided methods, and refine map editing workflows.
In CViz Pro, the “Scenarios” tool class opens scenario administration.
Scenario Manager is where scenario definitions are managed (create, rename, reorder, remove).
Launch Scenario Manager window.
Initialize view model using current analysis.
Open Scenarios first to define alternatives.
Use Scenario Selector for day-to-day switching.
Return to Scenarios to branch/refine options.
Use clear naming conventions for comparability.
Duplicate high-performing scenarios and test incremental variants.
In CViz Pro, the “Scenario Selector” tool is the control center for scenario context. It determines which scenario receives edits and calculations.
A scenario is a named analysis alternative. The active scenario controls where assumption edits, feature edits, and update results are written.
Display current scenario list.
Track scenarios, add/remove/reorder/rename events.
Change active scenario when the user picks a new item.
Open project/analysis.
Verify active scenario in the combo box.
Switch scenario before edits.
Repeat switch → edit → update as needed.
Always confirm the active scenario before using Paint, assumptions, or update tools.
If scenarios are renamed/reordered in Scenario Manager, confirm the selector updated as expected.
In CViz Pro, the “Assumptions” tool class opens assumption editing.
Assumptions are scenario-specific policy/economic/environment inputs.
Show assumptions dock pane.
Switch active scenario.
Edit assumptions.
Run update/calculation.
Compare outputs.
Change one major variable family at a time for interpretability.
Log important assumption changes per scenario.
In CViz Pro, the “Attributes” tool class opens attribute/formula-oriented views.
Attributes and formulas hold much of scenario-dependent computation logic.
Show attributes dock pane.
Select active scenario.
Open Attributes.
Edit/inspect formula-driven fields.
Update analysis.
Keep formula edits traceable per scenario.
Re-open pane if switching context after major layer changes.
In CViz Pro, the “Indicators” tool class opens KPI review and comparison.
Indicators provide performance feedback (cost, capacity, impact, etc.) for each scenario.
Show indicators dock pane.
Recalculate analysis.
Open Indicators.
Compare scenario KPI deltas.
Validate unsupported formulas if an indicator warns it cannot update in Pro.
Use indicators as decision gates before design iteration.
In CViz Pro, the “Tags” tool class organizes analysis components for large projects.
Tags help categorize assumptions, indicators, charts, and other components for filtering and governance.
Launch Tag Manager dialog.
Bind to current analysis context.
Define a tag taxonomy early (policy area, geography, phase).
Apply tags consistently.
Use tags for filtering and review.
Keep tag vocabulary short and stable.
Prefer reusable tags over ad hoc one-offs.
In CViz Pro, the “Charts” tool class opens chart-based comparison views.
Charts communicate scenario outcomes side-by-side.
Show chart dock pane.
Enable chart filtering and display management through pane VM.
Update analysis.
Open Charts.
Compare key outcome metrics across scenarios.
Use consistent scenario naming for readable legends.
Re-run updates before chart comparisons.
In CViz Pro, the “Data” tool class opens the layer management pane for CViz layers.
The Data pane manages dynamic/reference layer state and supports operations like refresh/remove flows.
Show the CViz Pro Data dock pane.
Open Data pane after loading an analysis.
Validate dynamic vs linked/reference layers.
Refresh source data where needed.
Check dependencies before removing layers.
Use this pane as the first place to inspect layer health.
In CViz Pro, the “Saved Views” tool class manages reusable map/view states.
Saved views improve repeatability for review presentations and QA checks.
Open Saved View Manager.
Initialize VM from current analysis.
Define standard review extents.
Save key map states.
Use same views across scenario comparison meetings.
Create naming standards (e.g., “Downtown-Transit”, “Watershed-North”).
Tools to answer more targeted planning questions.
Allocator Wizard helps determine where growth is most likely to occur over time. It uses the classic supply-and-demand approach, allocating new growth to available building locations sequentially over time, using either strict-order or probability-based models. (This premium feature is available only with CommunityViz Professional licenses.)
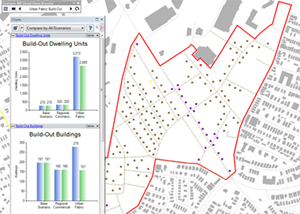
Build-Out Wizard performs all the work necessary for a build-out analysis, which shows the “capacity” of your land based on all the commercial and/or residential building allowed by current land-use regulations. This very popular CommunityViz feature supports numeric, spatial, and even 3D visual build-out analysis, and it works with everything from a simple land-use map to complex zoning codes – include as much or as little data as you want.
Land-Use Designer allows you to study the impacts of alternate land-use plans with just a few clicks of the mouse. A special dialog helps you choose pre-defined or custom land-use models. Once they have been created, land-use models provide an easy way to create land-use scenarios and impact analyses simply by sketching on the map. Each model specifies the name and particular characteristics of a given land use, such as building density and resource utilization rates. When you apply a land use to a feature on the map, the feature takes on all the specified characteristics, and corresponding impacts are calculated automatically.
Suitability Wizard lets you create site suitability or desirability analyses via an easy-to-use, step-by-step wizard. Just specify the factors you want to consider – like proximity to roads and overlap with floodplains, for example – and the wizard sets up a complete analysis for you. Once the analysis has been created, you can color code your map according to which sites are most suitable, and you can dynamically change the weighting of each factor and see the results.
Common Impacts Wizard automatically creates GIS-based impact analyses commonly associated with growth and development. You can instantly start to see some of the most commonly used indicators of economic, environmental, and social outcomes associated with alternative growth scenarios. The analyses created include everything you need: formulas, indicators, charts, reports, and variable assumptions with default values to serve as a starting point.
Here are the impacts the wizard can potentially create, depending on the information you provide, and the impacts you ask for:
The Custom Impacts Wizard sets up analysis models for impacts that are important to you but that are not covered in the Common Impacts Wizard or elsewhere. You specify the type of analysis you want – counts, sums, classifications – and the parameters you want to use. The wizard takes it from there, setting up the formulas, attributes, indicators, assumptions and charts you can use to see how your impact is affected by potential decisions you might make. The impact models supported by the Custom Impacts Wizards cover some of the most commonly used simple structures. For example, you can:
Optimizer helps you choose the best combination of features to satisfy certain goals, such as which parcels to conserve given a finite conservation budget. Its advanced, super-fast Modified Simplex Method algorithm allows you to work with large numbers of features in short times, even on an ordinary desktop computer. (This premium feature is available only with CommunityViz Professional licenses.)
Hands-on editing layer of CVizPro scenario planning.
Paint styles drive edits
A paint action applies style-defined attribute values to features in a target layer.
Two sketch modes for different editing intent
Point/drag paint: quick edits to one feature or a small swath of nearby features.
Polygon paint: explicit area-based editing when you need clear boundaries.
Scenario-aware editing
Edits are made in the currently active scenario context. Confirm the active scenario before painting.
Dynamic update control
With updates enabled, formulas and dependent results refresh as edits occur. Use Suspend Updates when batching many edits to improve responsiveness.
Styles are reusable editing standards
The Style Manager is where teams standardize and maintain paint styles so edits stay consistent across users and sessions.
Primary map-editing tool for applying a selected style to features.
Best for: parcel-by-parcel changes, block-level updates, and area sweep edits.
Common actions:
Choose a style.
Choose point or polygon mode.
Paint features that intersect the sketch.
Optionally apply the selected style to currently selected features.
Administrative workspace for creating, organizing, and maintaining paint styles.
Best for: setting up a shared style library before intensive scenario editing.
Common actions: define style names, target layers, and included attribute values.
Performance and workflow control for dynamic computations.
Best for: large edit batches where continuous recalculation would interrupt editing flow.
How to use:
Click Suspend Updates before a bulk edit pass.
Complete edits.
Click again to resume and run refresh calculations.
Set the active scenario first.
Confirm you are in the correct scenario to avoid editing the wrong alternative.
Review analysis setup.
Verify assumptions, indicators, and key layer settings are ready.
Prepare paint styles.
In Style Manager, confirm styles reflect your land-use or policy categories.
Start with broad sketch edits.
Use polygon mode for district/area-level changes.
Refine with point/drag edits.
Use fine-grain paint for parcel-level corrections.
Use suspend/resume strategically.
Suspend during heavy editing; resume to recalculate and validate outcomes.
Validate impacts.
Check indicators/charts/attributes to verify edits produce expected scenario behavior.
Iterate with guided tools as needed.
Re-run Suitability, LUD, Allocator, or BuildOut if manual edits suggest a new modeling pass.
Name styles clearly (for example, Residential-Medium, MixedUse-Core) to reduce operator error.
Apply on selections when possible for controlled, repeatable edits.
Use polygon mode for auditability when you need a visible, intentional edit boundary.
Suspend only when necessary; don’t forget to resume before reviewing scenario metrics.
Work in passes (coarse edits, then refinements) instead of random single edits.
Sanity-check with indicators/charts after every major edit batch.
Coordinate team conventions for style naming and allowed attribute combinations.
Save frequently at key milestones in your scenario editing session.