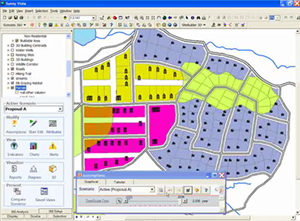
CommunityViz Scenario 360: analyze, visualize, and engage

CommunityViz Scenario 360 is GIS-based decision support software for regional and local planners. It is an ArcGIS® extension that adds interactive analysis tools and a decision-making framework to the ArcGIS platform. Scenario 360 helps you view, analyze and understand land-use alternatives and impacts.
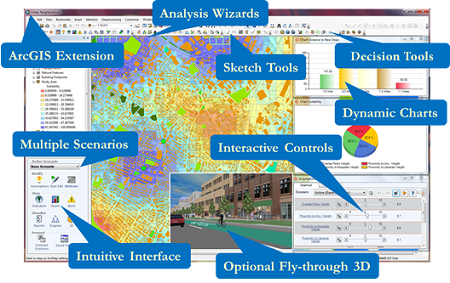
Scenario 360 is a powerful, easy-to-use tool that makes the land-use planning process more visual, more collaborative and more effective. Some of the key features include:

Visit the tabs in this section to learn more about applications, decision tools, and how Scenario 360 helps you as a planner to analyze, visualize, and engage.
Click here to see the Scenario 360 Factsheet.
Scenario 360 is a component of CommunityViz 5.x.
Scenario 360 is a powerful, easy-to-use tool that makes the land-use planning process more visual, more collaborative, and more effective.
Scenario 360 runs as an extension to ArcGIS Desktop and integrates smoothly with the rest of ArcGIS.
Scenario 360 is a desktop application. If you have the Network Analyst or Spatial Analyst extensions, Scenario 360 can use them for network-based or raster-based formula functions. If you have the 3D Analyst extension, Scenario 360 can be run as an extension to ArcScene.
Scenario 360 takes advantage of the powerful capabilities of ArcGIS so it can use almost any data that ArcGIS can.
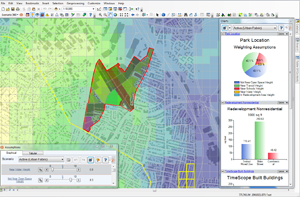
CommunityViz Scenario 360 provides a unique and powerful framework for planning analysis.
Real-Time Modeling
Scenario 360 dynamic analysis lets you ask “what-if…?” questions about alternative planning strategies and future events, then get answers in real-time as you experiment and discuss.
Dynamic Analysis Engine™
The unique Scenario 360 Dynamic Analysis Engine lets you do geospatial modeling of the effects of any potential plan. Study housing, transportation, environment, economics, sustainability, and much more. Choose from more than 100 built-in indicator models, or customize and create your own.

Get the information you need, when you need it
Scenario 360’s powerful, versatile, and unique Dynamic Analysis Engine is perfect for planning decisions
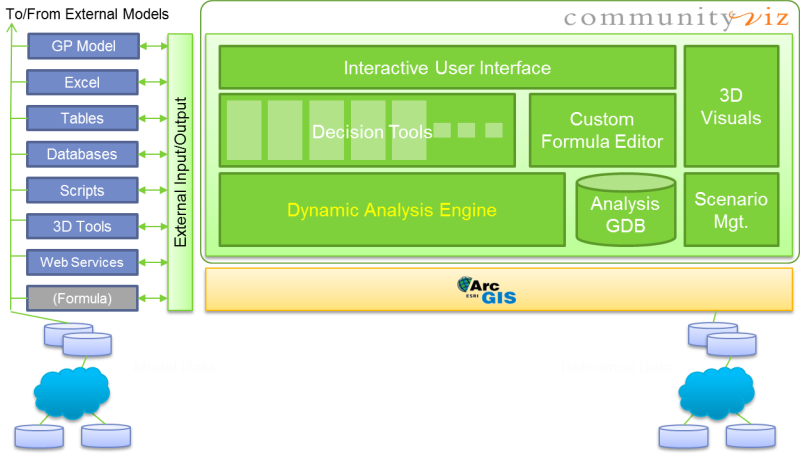
Good planning decisions are based on good models: How much will this planning approach cost? What will it do to water quality? How much housing will it provide?
With Scenario 360, you get immediate answers to those kinds of questions. It’s done with formula-based calculations running in an open modeling environment. Scenario 360 models are:
Thinking of a particular planning application, like build-out, suitability assessment, or impact analysis? Scenario 360 also has a collection of easy-to-use Decision Tools (also known as planning apps) to speed you along.
Understand your choices
Scenario 360 allows you to create, analyze, and work with multiple alternatives for the future of a place—all in real time.
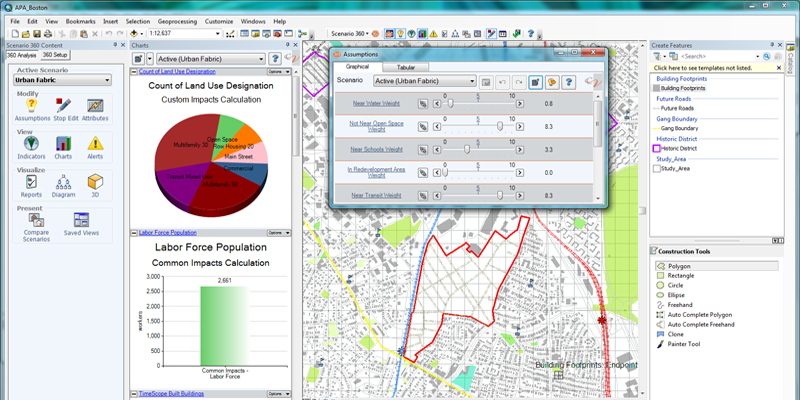
Scenarios are an effective method for making informed planning decisions. Before you write a plan or start implementation, you consider several alternatives—called scenarios—and study the pros and cons of each. From there, you can refine your ideas to choose the best course of action.
Dynamic analysis lets you work with scenarios in real time.
Ask “what-if…?” questions about alternative planning strategies or uncertain future events. Try adding infrastructure or changing zoning, and see what happens. This iterative process, sometimes called geodesign, is perfect for early planning discussions and group meetings.
Scenario 360 provides a powerful array of tools for creating scenarios:
Analyzing and comparing scenarios is taken care of for you:
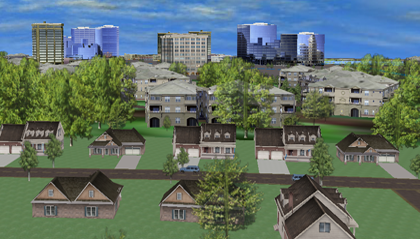
Scenario 360 allows you to connect to 3D visualization tools, giving you new ways to see your community as it is or as it could be.
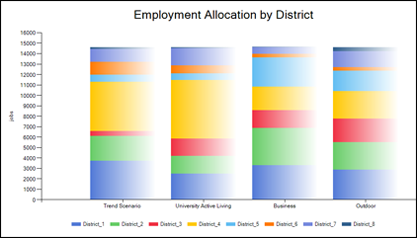
Scenario 360 includes special charts that provide dynamically updated visual displays of information you want to know.
You can set up the charts to display a single variable, multiple variables, multiple scenarios, and previous values. Curious about where the information is coming from? Click right on the chart to see the data and assumptions behind it. You can also embed charts right on your map using the Chart Elements feature.
Decision tools help you accomplish common planning tasks like build-out and suitability analysis.
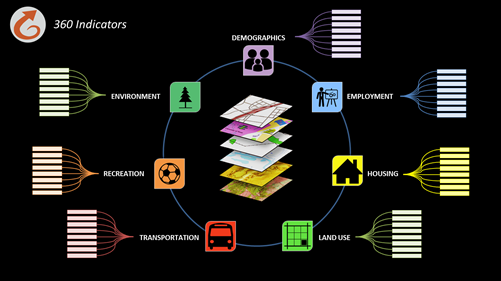
The 360 Indicators Wizard is meant to give you a comprehensive, well rounded set of standard planning measurements (indicators) related to your study area. The actual number of indicators generated will depend on your settings, but 101 are potentially available. Topic areas cover land use, demographics, transportation, recreation, environment, housing, and employment.
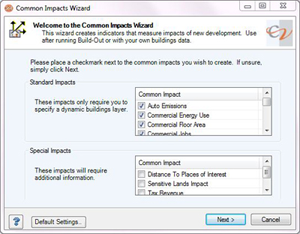
Common Impacts Wizard automatically creates GIS-based impact analyses commonly associated with growth and development. You can instantly start to see some of the most commonly used indicators of economic, environmental, and social outcomes associated with alternative growth scenarios. The analyses created include everything you need: formulas, indicators, charts, reports, and variable assumptions with default values to serve as a starting point.
Here are the impacts the wizard can potentially create, depending on the information you provide, and the impacts you ask for:
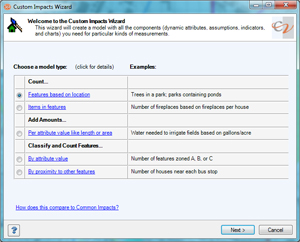
The Custom Impacts Wizard sets up analysis models for impacts that are important to you but that are not covered in the Common Impacts Wizard or elsewhere. You specify the type of analysis you want – counts, sums, classifications – and the parameters you want to use. The wizard takes it from there, setting up the formulas, attributes, indicators, assumptions and charts you can use to see how your impact is affected by potential decisions you might make. The impact models supported by the Custom Impacts Wizards cover some of the most commonly used simple structures. For example, you can:
![]()
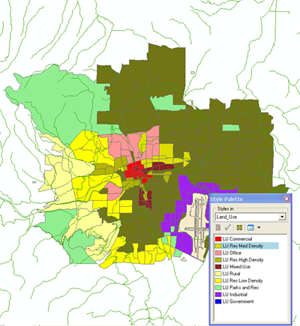
Land-Use Designer allows you to study the impacts of alternate land-use plans with just a few clicks of the mouse. A special dialog helps you choose pre-defined or custom land-use models. Once they have been created, land-use models provide an easy way to create land-use scenarios and impact analyses simply by sketching on the map. Each model specifies the name and particular characteristics of a given land use, such as building density and resource utilization rates. When you apply a land use to a feature on the map, the feature takes on all the specified characteristics, and corresponding impacts are calculated automatically.
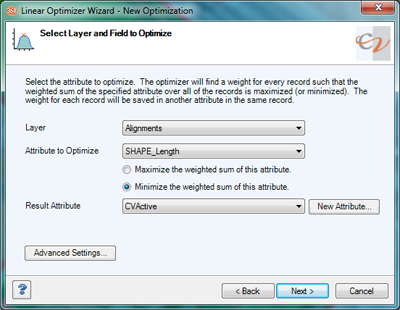
Optimizer helps you choose the best combination of features to satisfy certain goals, such as which parcels to conserve given a finite conservation budget. Its advanced, super-fast Modified Simplex Method algorithm allows you to work with large numbers of features in short times, even on an ordinary desktop computer. (This premium feature is available only with CommunityViz Professional licenses.)
Suitability Wizard lets you create site suitability or desirability analyses via an easy-to-use, step-by-step wizard. Just specify the factors you want to consider – like proximity to roads and overlap with floodplains, for example – and the wizard sets up a complete analysis for you. Once the analysis has been created, you can color code your map according to which sites are most suitable, and you can dynamically change the weighting of each factor and see the results.
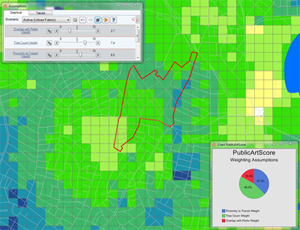
Allocator Wizard helps determine where growth is most likely to occur over time. It uses the classic supply-and-demand approach, allocating new growth to available building locations sequentially over time, using either strict-order or probability-based models. (This premium feature is available only with CommunityViz Professional licenses.)
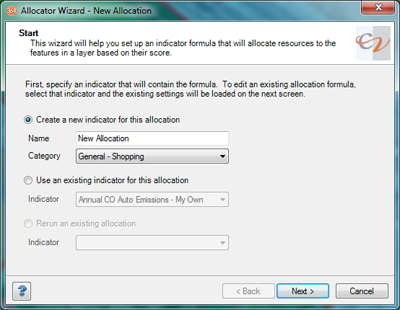
Allocator 5 is a sophisticated land-use allocation modelling (LUAM) tool for regional planners that models patterns of spatial growth over time. (This premium feature is available only with CommunityViz Professional licenses.)
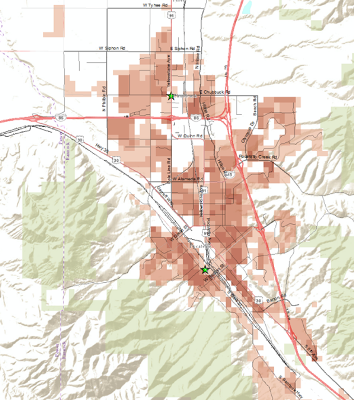
Build-Out Wizard performs all the work necessary for a build-out analysis, which shows the “capacity” of your land based on all the commercial and/or residential building allowed by current land-use regulations. This very popular CommunityViz feature supports numeric, spatial, and even 3D visual build-out analysis, and it works with everything from a simple land-use map to complex zoning codes – include as much or as little data as you want.
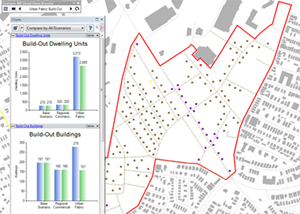
TimeScope™ lets you look at incremental changes year-by-year. Buildings and roads appear on the landscape; infrastructure capacity fills up; land-uses change; and impacts update – all according to rules and assumptions you set. Results can even be used with the Timeline in Google™ Earth.
