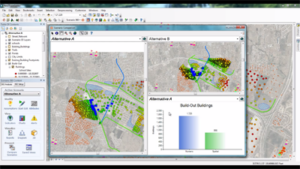
How to looks at scenarios, charts and maps side-by-side using the Comparing Scenarios window in Scenario 360 (1:47).
Download Transcript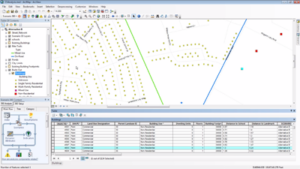
An introduction to a key aspect of CommunityViz dynamic analysis: Scenario 360 dynamic attributes, which are formula driven and update in real time (6:09).
Download Transcript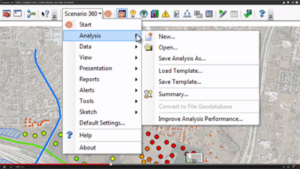
Identifies the different icons and features on the Scenario 360 toolbar, dropdown menu, content window, and table of contents (5:09).
Download Transcript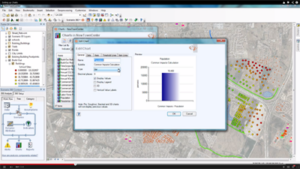
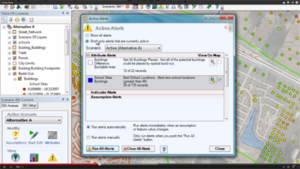
Provides a demo of creating and using CommunityViz alerts. Alerts can be set to notify you if a goal, target, threshold, or constraint condition associated with an assumption, dynamic attributes, or indicator has been reached (3:11).
Download Transcript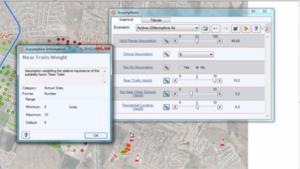
A basic demo of how to use CommunityViz Assumptions. An assumption is a value that is used as an input to an analysis. They are usually changeable and always apply to an entire scenario. (5:50).
Download Transcript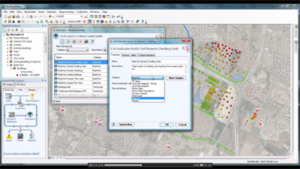
Provides a how-to on using Scenario 360 indicators. Indicators are impact or performance measures used to provide an overall measurement and they apply to an entire scenario (4:10).
Download Transcript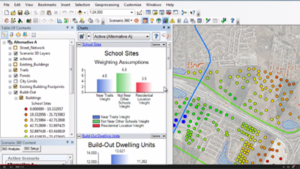
A basic how to on viewing charts in CommunityViz Scenario 360. In Scenario 360, charts are dynamically linked to assumptions and indicators and as changes are made in the analysis, chart displays will update automatically to reflect analysis results (3:00).
Download Transcript
Please Note: These videos are representative of legacy v5.2 functionality. We are currently developing new videos to reflect the latest CViz Pro release. These videos can still be used for demonstration of CommunityViz logic